
The EVE Online Monthly Economic Report for June 2025 rolled out late last week so it is time to take a peek at that.
EVE Online nerds harder
As always, others write and comment about the MER, so if you are interested there are sources worth seeking.
CCP highlights
This is what CCP put at the top of the report and it is always interesting to see what they think is worthy of note.
-
Production value has declined to levels last seen in April. A similar downward trend is visible in Mining value, which has now reached its lowest point this year.
-
All top four sink categories have returned to the levels recorded prior to May.
-
We may be seeing the first signs of MPI stabilization – it recorded a modest increase of 1.01% compared to May, marking the first uptick since the major update in March.
The first… well, there are lots of reasons things could be down from peak… and NPC bounties were down as well. Even with the expansion landing in the south of null sec at least we stopped battles and industry to engage in move ops. Delve saw a net of 138 Trillion ISK in value depart the region according to CCP’s chart (thanks in part to The Big Scoop that saw hundreds of structures packed up and hauled off), with a corresponding 352 Trillion ISK in value arriving in Insmother as Goonswarm packed things up and started moving from Tenerifis to their new home.
Or maybe it was just the dreaded and long argued over “summer slump?”
On the top four ISK sink categories (Transaction Taxes, the LP Store, Manufacturing Fees, and Broker’s Fees) one might imagine if production was down, that might be down as well.
While there I will also mention that the Active ISK Delta, the change in ISK in the game by GM action or players going active/inactive, changed by a pretty small amount in June.
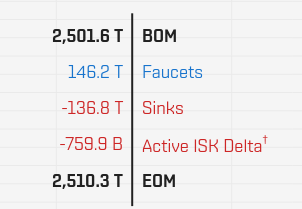
June 2025 – Active ISK Delta
I suspect that is because the people who would come back for the seven free days of Omega time with the expansion are the same people who would have come back for the free days handed out in early May with Fanfest and Capsuleer Day, so they had not hit the 90 day inactive mark, which is when their ISK is then withdrawn from calculations.
Also… a lot of sink activity in June.
Finally, the Mineral Price Index is… stabilizing? I mean, technically, it only changed a bit. Then again, it did cease its decline and rise back up slightly at the previous all time peak
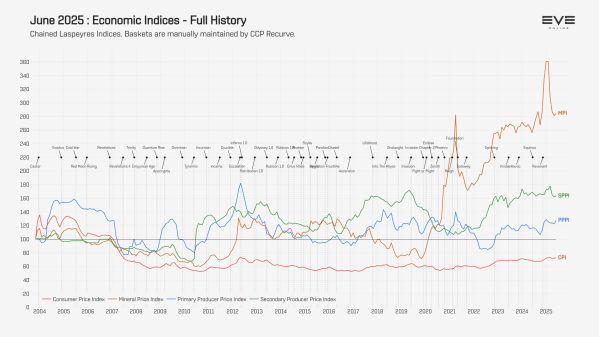
June 2025 – All Time Economic Indices
Now, maybe that is because mining was down so the plan to get more pyrite into the economy hasn’t had enough time to work. But I am not sure I would be taking a victory lap just yet. Meanwhile, the consumer price index is made up of a basket of goods that seems completely unaffected by mineral price changes. That might lead one to ask if the mineral prices matter (they do for producers), if other lower priced materials are balancing that out, or if the basket of goods being used to draw that line is made up of the right mix.
Destruction
On the destruction front, total losses were down by more than one would expect relative to May allowing for one less day in the month. The average losses per day count was down.
On the other hand, the total ISK value lost was close to that of May, so the average value of a loss in June was up a bit from May. Numbers below:
- Loss Count Total
- January – 514,511 total losses
- February – 427,027 total losses
- March – 538,625 total losses
- April – 464,177 total losses
- May – 530,632 total losses
- June – 476,877 total losses
- Avg Losses per Day
- January – 16,597.13 losses per day
- February – 15,250.96 losses per day
- March – 17,375.00 losses per day
- April – 15,472.57 losses per day
- May – 17,117.16 losses per day
- June – 15,895.90 losses per day
- Total ISK Value Lost
- January – 46.86 trillion ISK
- February – 44.55 trillion ISK
- March – 50.78 trillion ISK
- April – 47.77 trillion ISK
- May – 52.10 trillion ISK
- June – 51.39 trillion ISK
- Total ISK Value Lost per Day
- January – 1,511.77 billion ISK per day
- February – 1,590.99 billion ISK per day
- March – 1,638.07 billion ISK per day
- April – 1592.22 billion ISK per day
- May – 1680.63 billion ISK per day
- June – 1713.09 billion ISK per day
So what happened? Was it the invasion of Insmother?
No. That was not it at all. The top ten regions for total destruction were as follows:
| Region | Sum of ISK | % of June | Region | Count | % of June |
| Heimatar | 4.15 trillion | 8.07% | Delve | 35,699 | 7.49% |
| Pochven | 2.74 trillion | 5.33% | Black Rise | 30,351 | 6.36% |
| Delve | 2.46 trillion | 4.79% | Heimatar | 25,360 | 5.32% |
| The Forge | 2.23 trillion | 4.34% | The Forge | 22,665 | 4.75% |
| Insmother | 1.73 trillion | 3.36% | Metropolis | 19,852 | 4.16% |
| Vale of the Silent | 1.61 trillion | 3.14% | Placid | 16,176 | 3.39% |
| Black Rise | 1.46 trillion | 2.84% | Perrigen Falls | 15,643 | 3.28% |
| Perrigen Falls | 1.38 trillion | 2.69% | Pochven | 13,476 | 2.83% |
| Metropolis | 1.32 trillion | 2.58% | The Citadel | 13,266 | 2.78% |
| Sinq Laison | 1.27 trillion | 2.47% | Insmother | 13,181 | 2.76% |
Sure, Insmother made the list, but 5th place wouldn’t be much of a war. And Heimatar? Amarr space? Well, the break out by systems will help with that.
| System | Region | Sum of ISK | % of June | System | Region | Count | % of June |
| Siseide | Heimatar | 1.73 trillion | 3.37% | Jita | The Forge | 14,037 | 2.94% |
| Lantorn | Heimatar | 1.36 trillion | 2.65% | Ahbazon | Genesis | 7,966 | 1.67% |
| Jita | The Forge | .84 trillion | 1.63% | MJ-5F9 | Perrigen Falls | 6,331 | 1.33% |
| Ahbazon | Genesis | .67 trillion | 1.30% | Amamake | Heimatar | 5,978 | 1.25% |
| HB-1NJ | Great Wildlands | .53 trillion | 1.03% | 1DQ1-A | Delve | 5,894 | 1.24% |
| EFM-C4 | Insmother | .51 trillion | 0.99% | Siseide | Heimatar | 5,398 | 1.13% |
| MJ-5F9 | Perrigen Falls | .50 trillion | 0.98% | Aldranette | Placid | 5,293 | 1.11% |
| Hikkoken | Black Rise | .34 trillion | 0.66% | Tama | The Citadel | 4,609 | 0.97% |
| G-QTSD | Etherium Reach | .30 trillion | 0.58% | G-QTSD | Etherium Reach | 4,387 | 0.92% |
| E3OI-U | Delve | .29 trillion | 0.56% | Hikkoken | Black Rise | 4,047 | 0.85% |
On the 17th there was a big dread brawl in Lantorn, which featured Fraternity and The Initiative as part of the escalation, which helped drive Heimatar to the top.
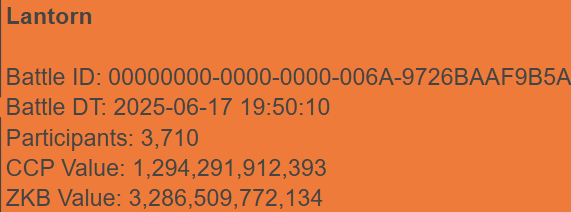
June 2025 – Lantorn
That was followed on the 21st by a rematch in Siseide that saw fewer participants but greater destruction.
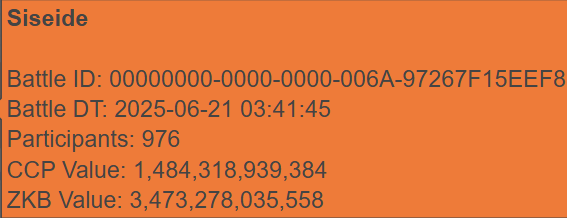
June 2025 – Siseide
Meanwhile, Delve captured the crown for total count of hulls destroyed. While there was quite a bit going on in Delve with move ops and new players coming into there and Querious, it was the destruction of the Goonswarm Keepstar in 1DQ1-A that drove the total, as it qualified for the battle with the most participants.
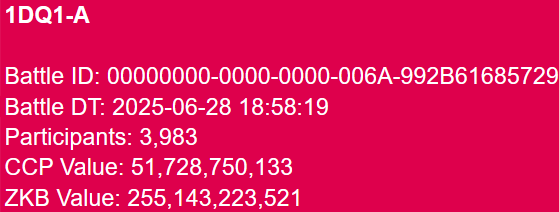
June 2025 – 1DQ1-A
The invasion of Insmother barely registered amid all of that, though two systems did crack the top ten for ISK losses, EFM-C4 and HB-1NJ, due to two uncontested Keepstar kills by the Imperium. That left a day by day view of ISK and hull losses looking like this.
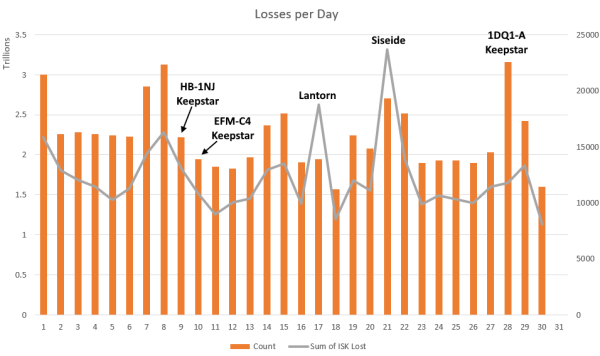
June 2025 – Losses Per Day
And so it goes, another month has gone by. The invasion of Insmother and related operations has been declared over by the Imperium, move ops continue as groups shift around in southern null sec, and we might see next month whether the summer slump… or maybe a post-war slump, though there was barely a war… is going to manifest itself in 2025.